I invest
Macro, central banks, positioning, valuation and event risk across rates, FX, equities, credit and commodities.
Nowcasts and central-bank analysis, systematic positioning, fair value, narrative virality, and weather and crop intelligence. Built in-house, updated daily, and turned into research that ends in a conclusion.
50+
proprietary models
56
markets tracked daily
16
crop regions monitored
30+ years
of weather history
Built for decisions
Macro, central banks, positioning, valuation and event risk across rates, FX, equities, credit and commodities.
Weather, crops, trade, freight, costs and money flows, turned into buying and hedging decisions.
See agricultureProprietary models
Built in-house, tested against history, and kept only if they hold up.
Where growth and inflation are heading before the official release.
What central banks are likely to do, against what markets price.
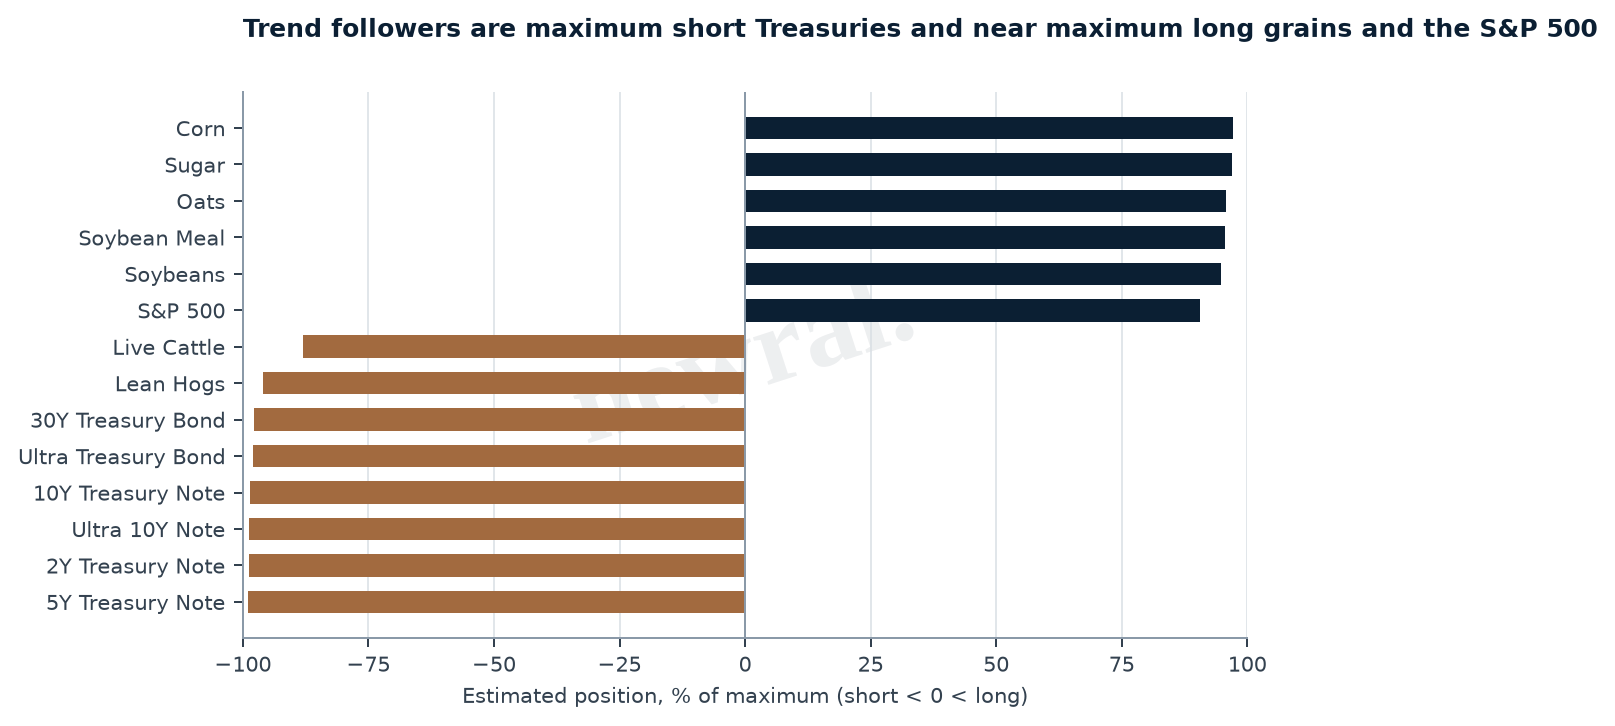
Estimated positioning of trend followers and other systematic funds across markets.
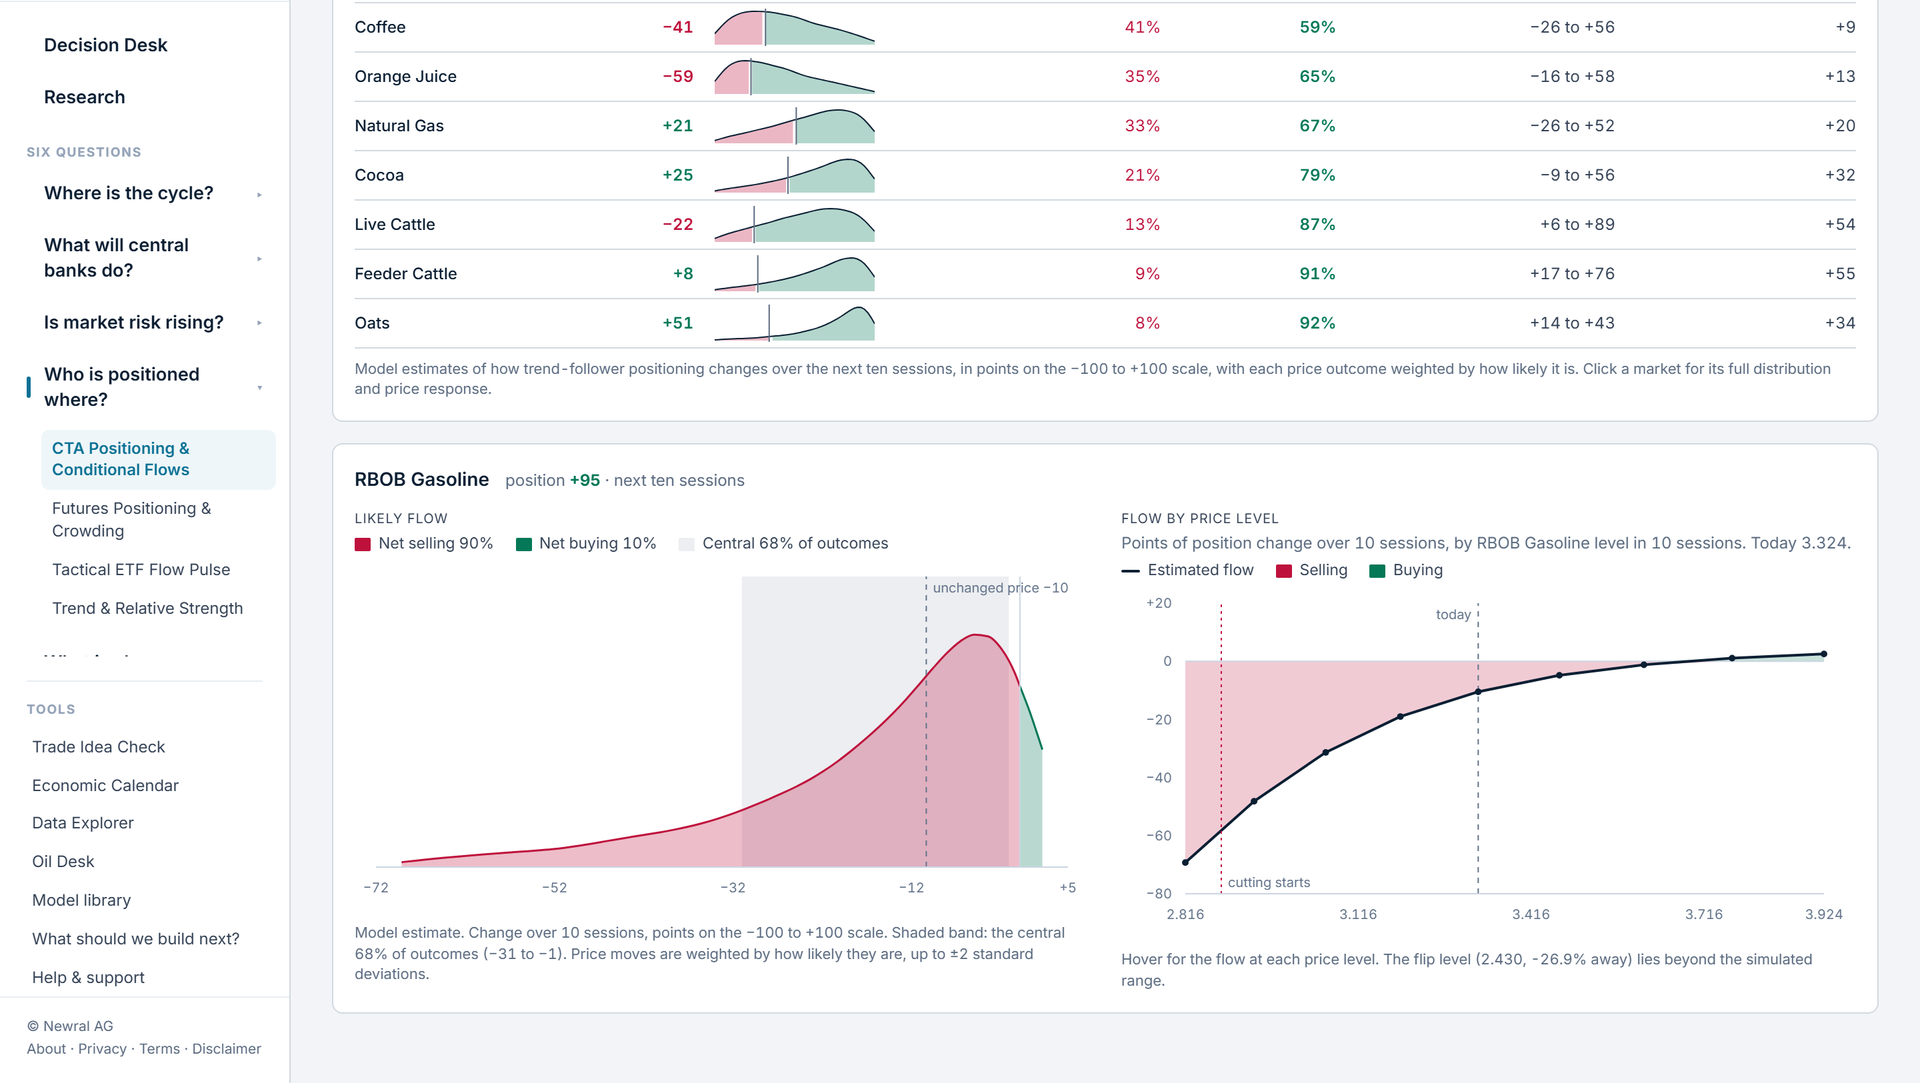
How much systematic funds would buy or sell as prices move, and at which levels.
Where each market trades against its fundamental anchors, and how far it has stretched.
Which market stories are gaining attention, and where the narrative runs ahead of prices.
How vulnerable markets are to a sharp move, beyond what volatility shows.
How a shock travels through households, firms, inflation and policy.
Inside the portal
What we cover
Growth and inflation nowcasts, central-bank paths and financial conditions.
Valuation, positioning, flows and event risk across rates, FX, equities, credit and commodities.
Weather and crops, trade flows, freight, fertiliser and energy costs, and policy.
A stronger dollar makes US grain more expensive abroad. A drought can lift food prices and shift interest-rate expectations. We analyse them together.
The portal
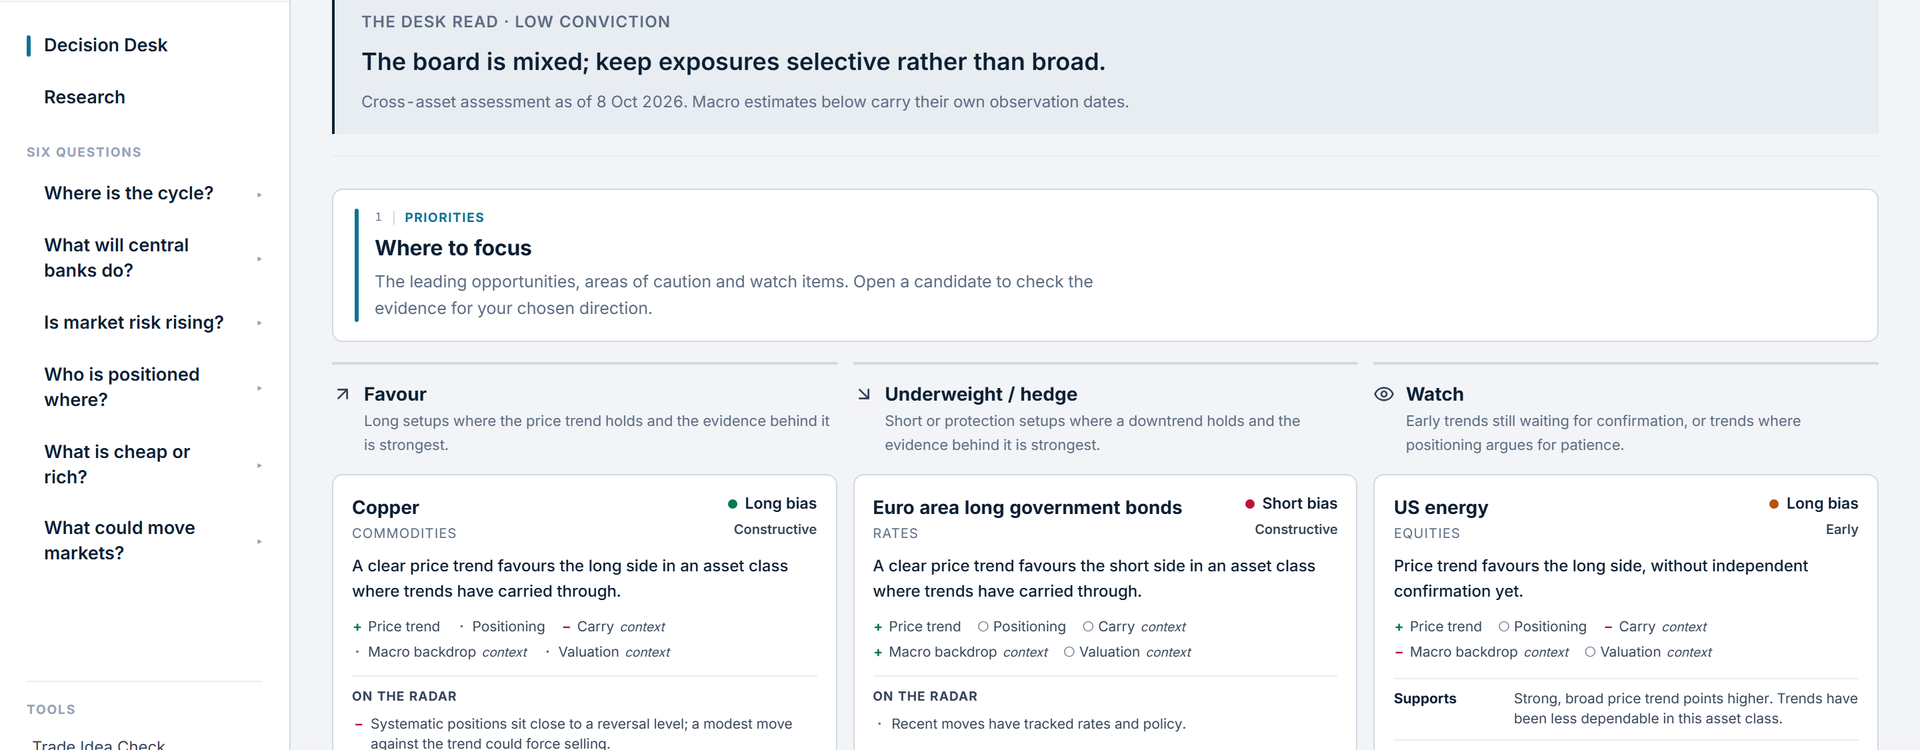
Plus a daily brief, a Decision Desk that weighs evidence across markets, and Trade Idea Check to test a view before you act.
Request portal accessHow we work
State-of-the-art AI pipelines collect, check and update thousands of data points every day across economies, markets and crop regions. That leaves our analysts free for what matters most: deciding what is important and what it means.
We don't trade, broker or sell financial products. Our analysis is our only product, which keeps it independent.
FAQ
Newral provides research and analytics that connect the economy, financial markets and physical commodities, delivered through a client portal, written research and bespoke work.
Professional investors, and businesses that buy, sell or hedge commodities.
Yes. Newral does not trade, broker or sell financial products. We are paid for our analysis, nothing else.
Proprietary models and dashboards organised around six questions: the economic cycle, central banks, positioning, valuation, market-moving events and market risk — plus a daily brief, Decision Desk and Trade Idea Check.
Yes. We publish agricultural market research covering weather, crops, trade, freight, costs and policy, and build bespoke analysis for commodity buyers and sellers.
Request portal access or a sample note through the contact form. We respond within one to two business days.