CTA flow simulator: what trend followers could trade next
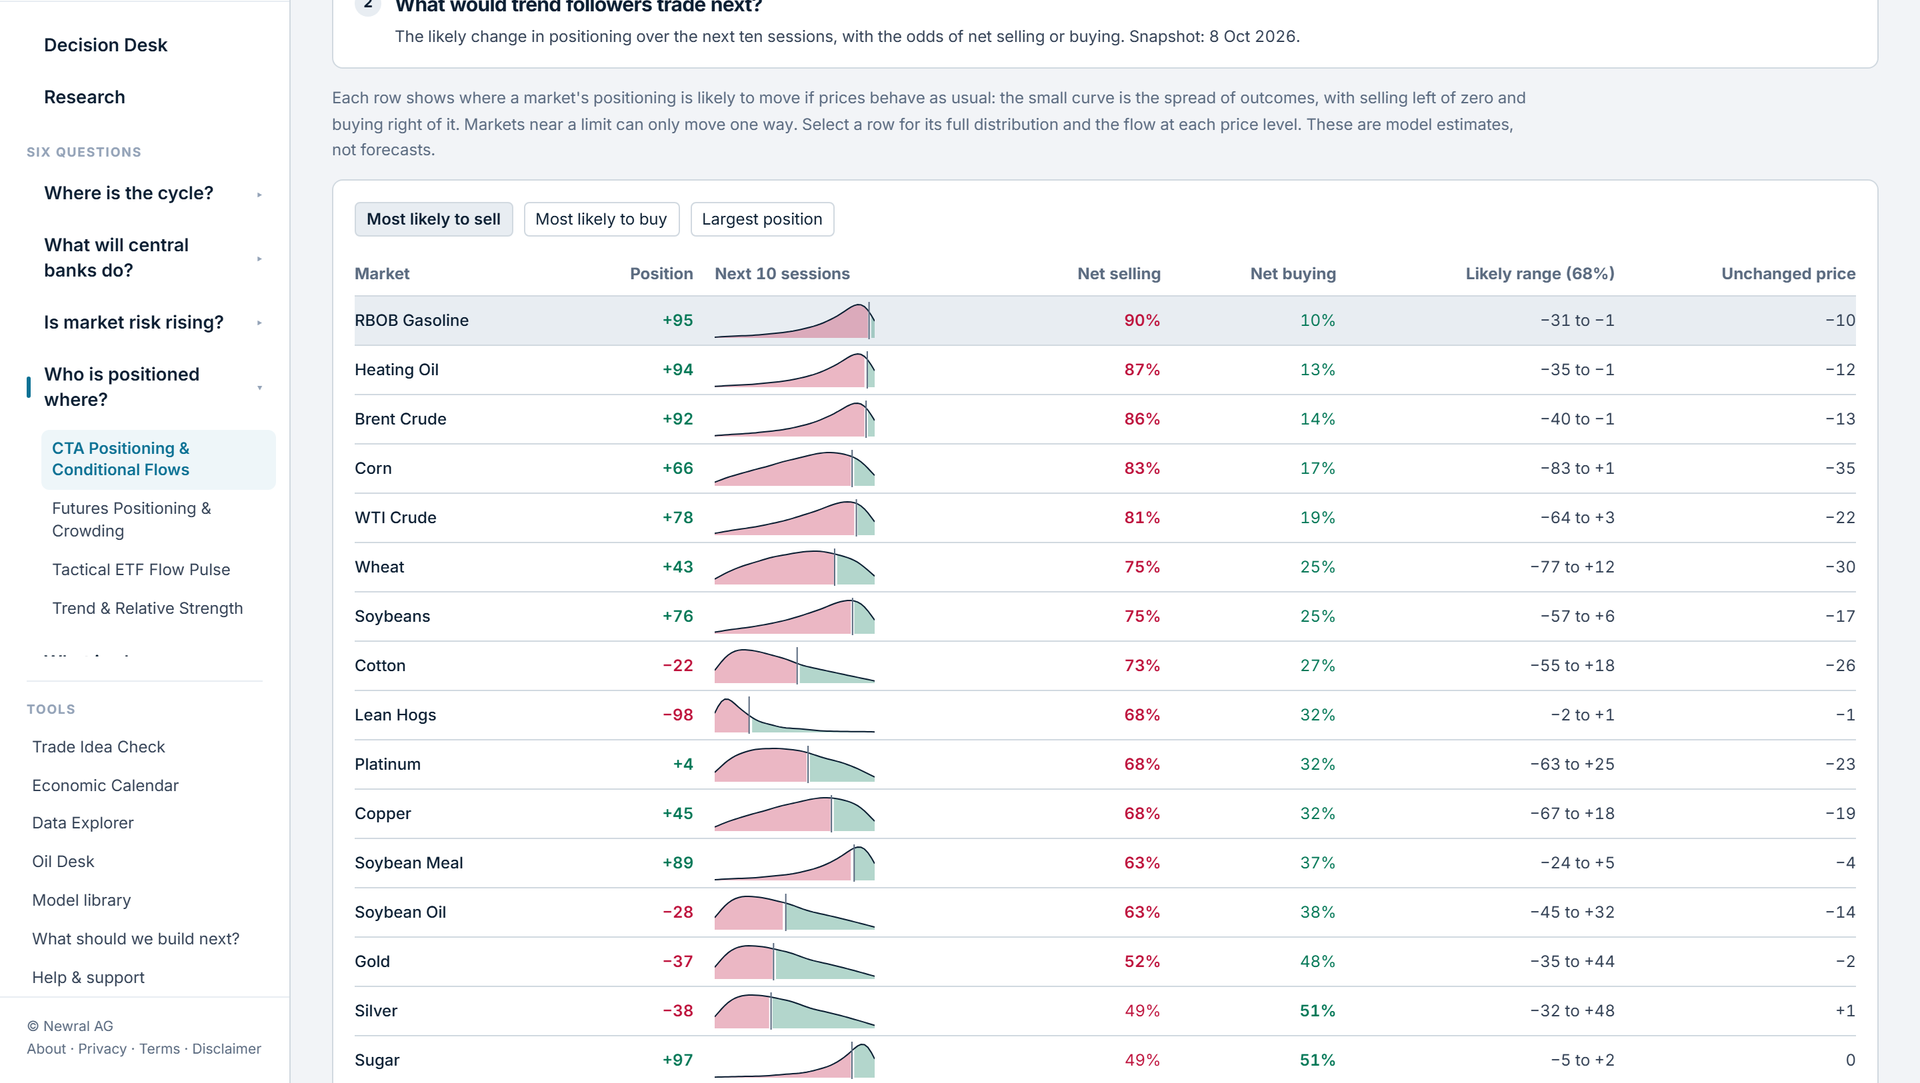
The CTA flow simulator estimates how trend-following positions could change over the next ten trading sessions if prices rise, fall or stay flat. For each futures market it reports the likely change in positioning, the odds of net buying or selling, and the price move at which systematic flows would switch direction.
The question it answers
If this market moves from here, would systematic trend followers add to the move or lean against it, and by how much?
How it works
The simulator starts from Newral's current position estimate for each market and asks a conditional question: if this market moves from here over the next ten sessions, how would trend followers respond? It explores a wide range of possible price outcomes, from sharp falls through an unchanged market to strong rallies, and works out how the modelled position would evolve in each case. The answer is expressed on the same -100 to +100 scale as the position estimate, so the size of a potential flow can be compared across markets. Bringing the outcomes together gives a central lean, a likely range and the odds of net buying or net selling. The simulator also maps flow by price level, showing where systematic cutting would begin and the price move at which the ten-session response changes sign. The result is a reaction function: it describes how systematic demand would respond to prices, not which way prices will go.
What you see in the portal
- Ten-session outlook for each market: the likely change in positioning and its range
- Odds of net buying versus net selling over the next ten sessions
- Flow by price level: the modelled change in positioning at each simulated price, marking where cutting starts and where the position flips
- The unchanged-price case: how positioning drifts if the market goes nowhere
- Rankings of the markets most likely to see systematic selling or buying
How clients use it
- Judge whether systematic rebalancing is more likely to amplify or cushion a move in a market you hold.
- Identify markets where an adverse move would trigger outsized systematic selling or short covering.
- Add a flow-pressure view to scenario planning ahead of key events and data releases.
Frequently asked questions
- What is a CTA flow simulator?
- A CTA flow simulator projects how trend-following funds' positions would change under different price paths. Rather than forecasting price, it asks a conditional question: if the market rises, falls or stays flat over the next ten sessions, how much would systematic positions grow or shrink? The output is a distribution of possible flows and the price moves that would change their direction.
- How are CTA flows estimated over the next ten sessions?
- Newral takes its current position estimate for each market and works out how that position would evolve across a wide range of possible price outcomes over the next ten sessions. Bringing those outcomes together gives the central lean, a likely range and the odds of net buying or selling, all on the same -100 to +100 scale as the positioning estimate, so flows can be compared across markets.
- What is the difference between a CTA flip level and a flow switch?
- A flip level is where the modelled position itself changes sign, from long to short or the reverse. A flow switch is the price move at which the ten-session change in position changes sign. The model can stay long while its flows switch from adding to reducing that long, so a flow switch often arrives well before a flip.
- Why do CTA flows change when prices are flat?
- Trend signals look back over a window of past prices. Even if the market does not move, the history that defines the trend keeps changing, so the measured trend can strengthen or fade on its own. The unchanged-price case shows this drift, which tells you whether an existing systematic position is likely to keep building or to decay without any new price move.