Weather and crop intelligence for agricultural markets
Weather and crop intelligence links growing conditions in the world's main crop regions to agricultural markets. Newral tracks rainfall, daytime heat and soil moisture across 16 crop regions, ranks each reading against every year since 1991, and adds seasonal outlooks, winter-kill exposure and crop-stage context, so weather risk can be read alongside supply, demand and positioning.
The question it answers
Is the weather in the regions that matter for grains, oilseeds and softs unusual for the time of year, and which way are seasonal forecast models leaning?
How it works
The stack covers 16 crop regions, from the US Corn Belt and the Brazilian Centre-West to the Black Sea, the Australian wheat belt and the West African cocoa belt. For each region it tracks recent rainfall, daytime heat and soil moisture in the main growing areas and compares them with every year since 1991, so unusual conditions stand out from routine variation. In frost season it also monitors winter-kill exposure, the combination of severe cold and thin snow cover that can damage winter crops. Seasonal outlooks from several forecast models are combined into a consensus lean for the coming months. Every reading is shown with the crop stage in that region at that time of year, so dryness during pollination is not read the same way as dryness after harvest.
What you see in the portal
- A crop-region weather table: crops and current stage, recent and seasonal rainfall, daytime heat against normal, soil-moisture rank and next-month outlook
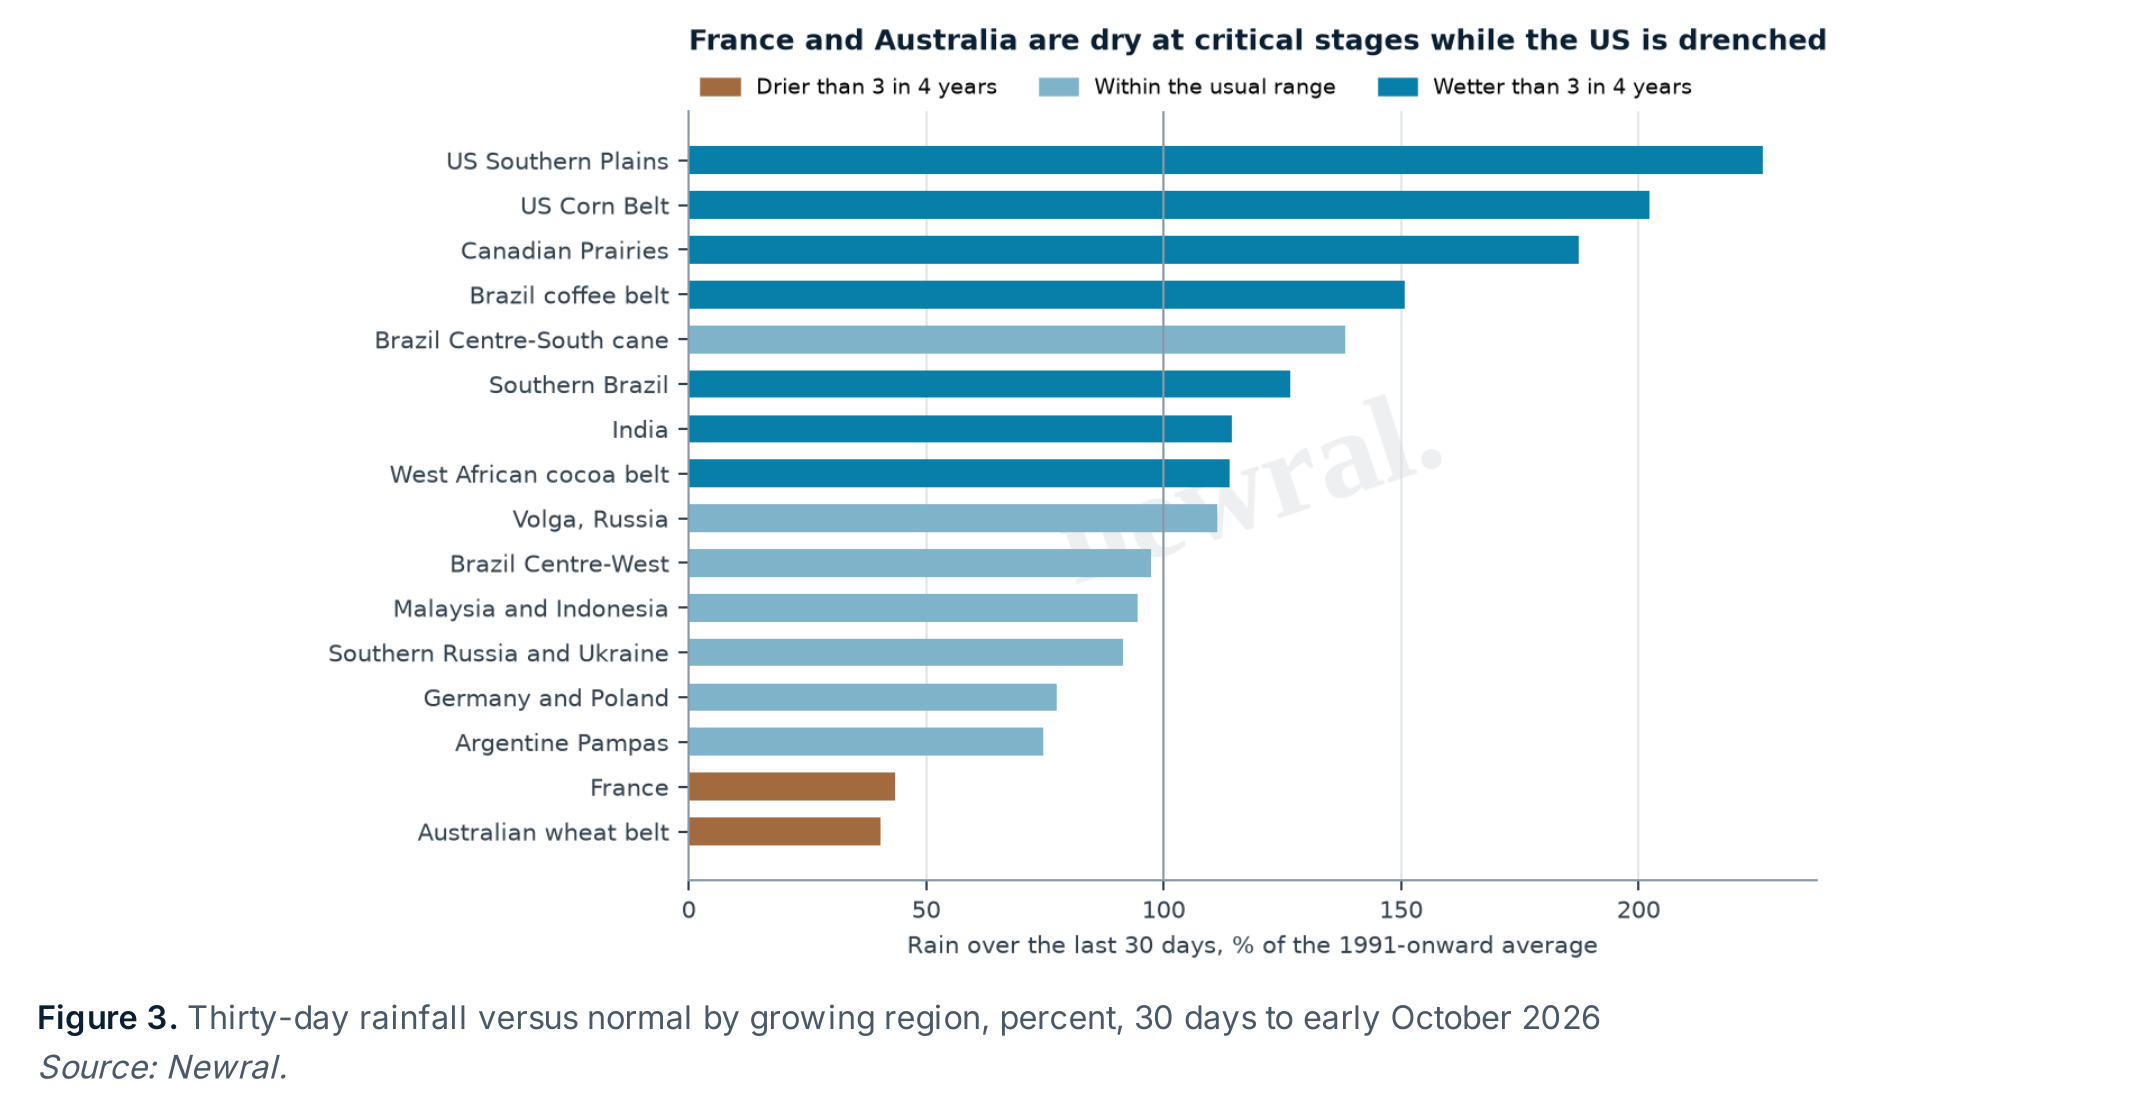
- Rainfall by region against the long-run average, highlighting regions drier or wetter than three years in four
- Soil-moisture extremes and, in frost season, winter-kill exposure
- Seasonal outlook leans for the coming months
- Market cards that set main-region rainfall beside balance sheets, demand and fund positioning
Delivered through Newral's agricultural markets research and its appendix rather than as a stand-alone portal page.
How clients use it
- Judge whether a weather story in a key region is genuinely unusual for the season or within the normal range.
- Track supply risk for procurement and hedging decisions across grains, oilseeds and softs.
- Read weather alongside balance sheets, trade flows and positioning instead of in isolation.
Frequently asked questions
- How does weather affect agricultural commodity markets?
- Weather drives crop yields, and yield expectations drive supply. Rainfall, heat and soil moisture matter most at critical stages, such as corn pollination or wheat grain fill, and in the regions that dominate global exports. Newral reads weather against history and crop stage in 16 crop regions, so unusual conditions in the places and weeks that matter stand out from routine variation.
- Which crop regions does Newral track?
- Newral tracks 16 crop regions: the US Corn Belt and Southern Plains, the Canadian Prairies, the Brazilian Centre-West, southern Brazil, the Brazilian coffee belt, Brazil's Centre-South cane region, the Argentine Pampas, France, Germany and Poland, southern Russia and Ukraine, the Volga region, the Australian wheat belt, India, Malaysia and Indonesia, and the West African cocoa belt.
- What is winter-kill risk for wheat?
- Winter-kill is damage to overwintering crops such as winter wheat caused by severe cold. Snow cover insulates the plants, so the risk is greatest when deep frost meets thin or absent snow. During frost season, Newral counts the days on which these conditions occurred in each relevant region and compares the count with the long-run normal.
- How are seasonal weather outlooks used for crops?
- Seasonal outlooks indicate whether the coming months are more likely to be wetter, drier, warmer or cooler than normal. Newral combines several seasonal forecast models into a consensus lean, which filters out weak or conflicting signals. Each lean is shown next to the region's crop stage, so it can be read against the part of the season it affects.