CTA positioning: where trend followers are positioned
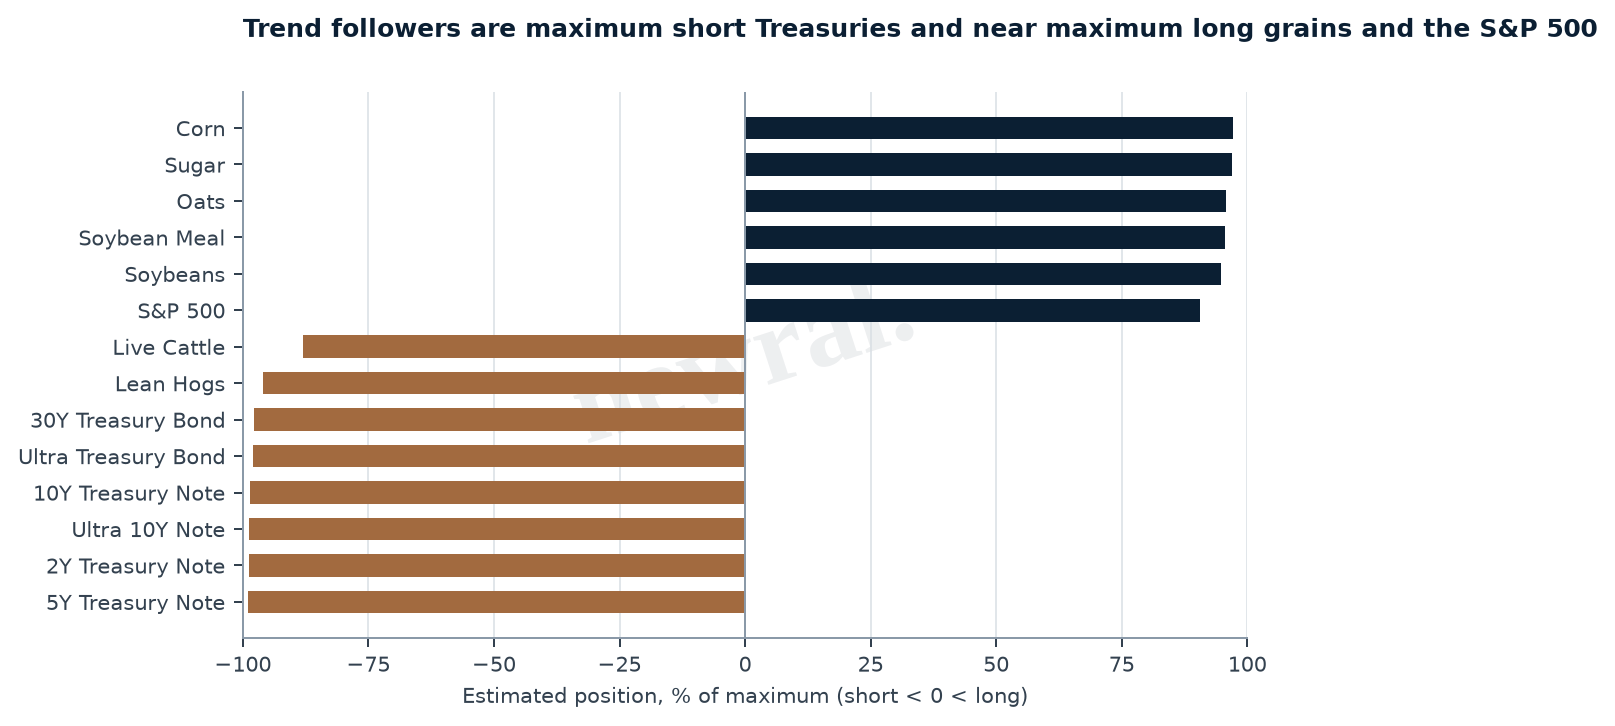
CTA positioning is an estimate of how systematic trend-following funds are likely to be positioned in a futures market, based on the price trends those funds follow. Newral's model expresses the result as a position score from -100 (maximum short) to +100 (maximum long) across commodities, equity indices, currencies and government bonds, with the price levels where that positioning would change.
The question it answers
Which way are trend followers leaning in each market, how stretched are they, and how far would prices have to move before they start cutting or reverse?
How it works
The model works from daily futures prices across more than 40 markets in four books: commodities, equity indices, currencies and government bonds. Prices are adjusted for contract rolls, so the switch from one futures contract to the next does not register as a trend. Newral's proprietary trend model replicates how a representative trend-following portfolio would read each market and turns that read into a position on a common scale. For every market it then identifies two reference levels: the first de-risk level, where the modelled position would start to shrink materially, and the direction-change level, where the overall signal would turn from long to short or the reverse. Because every market is modelled within the same framework, positions can be compared directly across asset classes, and the estimate can be refreshed every trading day rather than waiting for periodic positioning reports.
What you see in the portal
- Position score for each market on a common -100 to +100 scale, grouped by book
- First de-risk level and direction-change level, as a price and as the move required from today
- Flip levels for the shorter- and longer-term trend components in each market
- Where positioning is most concentrated, and which positions sit closest to a reference level
- A direct link to the ten-session outlook of likely buying or selling
How clients use it
- Check whether a crowded systematic position sits on the same side as your own exposure before adding to it.
- Monitor markets trading close to a de-risk or direction-change level, where a modest move could change systematic demand.
- Use positioning as market-structure context alongside fundamentals, valuation and liquidity when reviewing hedges.
Frequently asked questions
- How do you estimate CTA positioning?
- Newral models a representative trend-following portfolio from market prices using its own proprietary trend model, and expresses the result as a position score from -100 to +100 for every market. Because the estimate is built from prices rather than reported holdings, it can be updated every trading day instead of waiting for periodic positioning reports. It is a model of likely exposure across the trend-following industry rather than the holding of any single fund.
- What is a CTA flip level?
- A flip level is the price at which a trend-following signal changes sign, turning a modelled long position into a short, or the reverse. Newral shows flip levels for the main trend components and for the overall signal, each against the current price. A small distance to flip means the systematic position is more sensitive to a reversal. It is a reference level, not a price target.
- What is a CTA de-risk level?
- The de-risk level is the price at which the modelled trend-following position would have fallen materially from its current size, before the signal flips outright. It usually sits much closer to the current price than the flip level. When a market approaches its de-risk level, systematic selling into weakness, or buying back shorts into strength, becomes more likely within the model.
- Which markets does the CTA positioning model cover?
- The model covers more than 40 liquid futures markets in four books: commodities across energy, grains, softs, livestock and precious and base metals; major equity indices; currencies; and US government bond futures across the curve. Every market is modelled on the same framework, so positions can be compared across asset classes on one scale.