Research
Systematic positioning report
Systematic funds react to prices by rule, which makes their behaviour estimable. This report sets out where trend followers and other systematic funds are likely positioned, how much they would buy or sell as prices move, and the levels where that pressure builds — so you know where forced flows could amplify or cushion a move.
The models behind this research: CTA positioning and CTA flow simulator.
Structure
What's inside
- Key messages: the positioning shifts that matter most this time, stated up front.
- Evidence: estimated positions and how they changed across the largest markets.
- Flow scenarios: how much systematic funds would buy or sell as prices move, and at which levels.
- Implications: where forced flows could add to or absorb price moves.
- What would change our view: the price moves that would flip the picture.
Edition of 5 October 2026
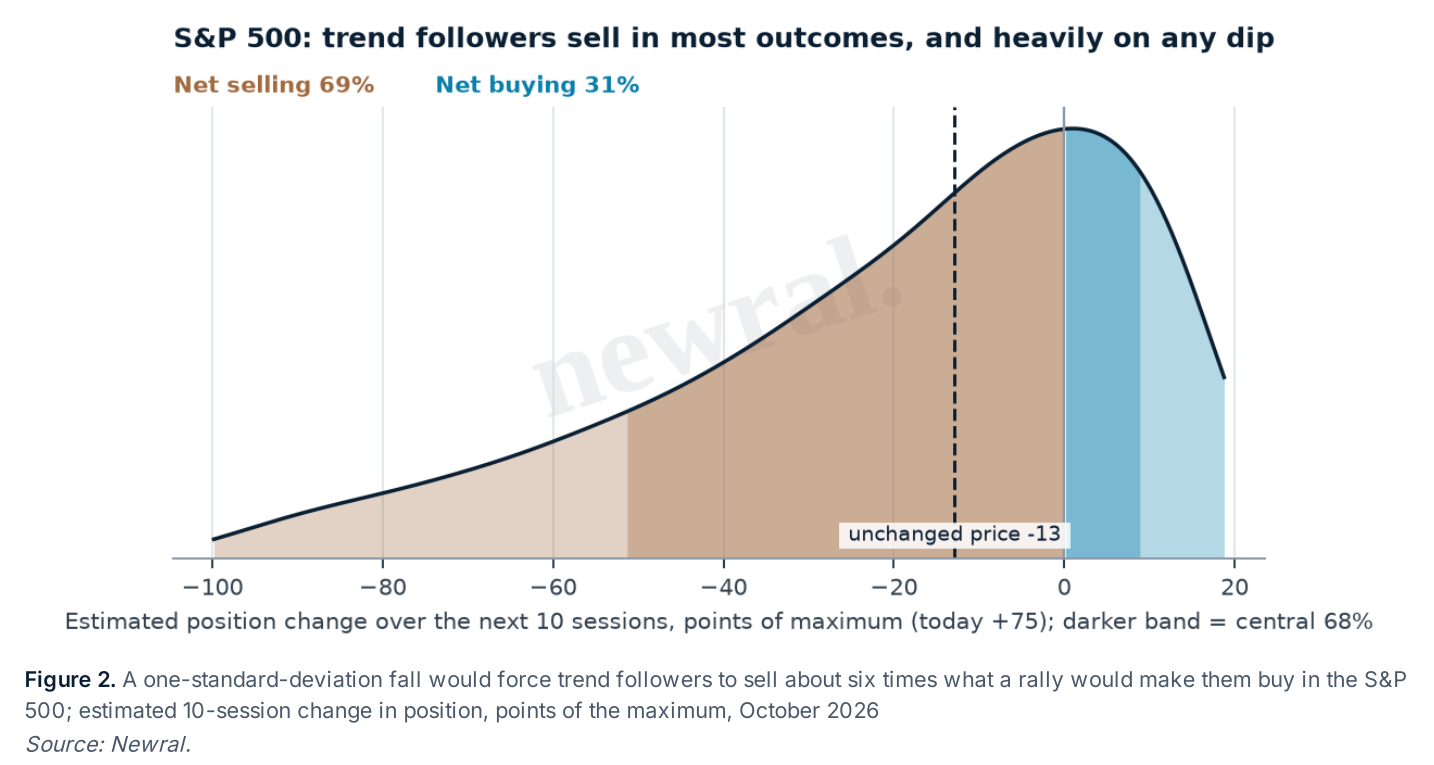
Trend followers' S&P 500 and crude longs sit just above their cutting levels
Key messages
- S&P 500: trend followers hold a large long that a modest dip would turn into heavy selling.
- Crude oil: the most exposed commodity long, with supply news as the trigger to watch.
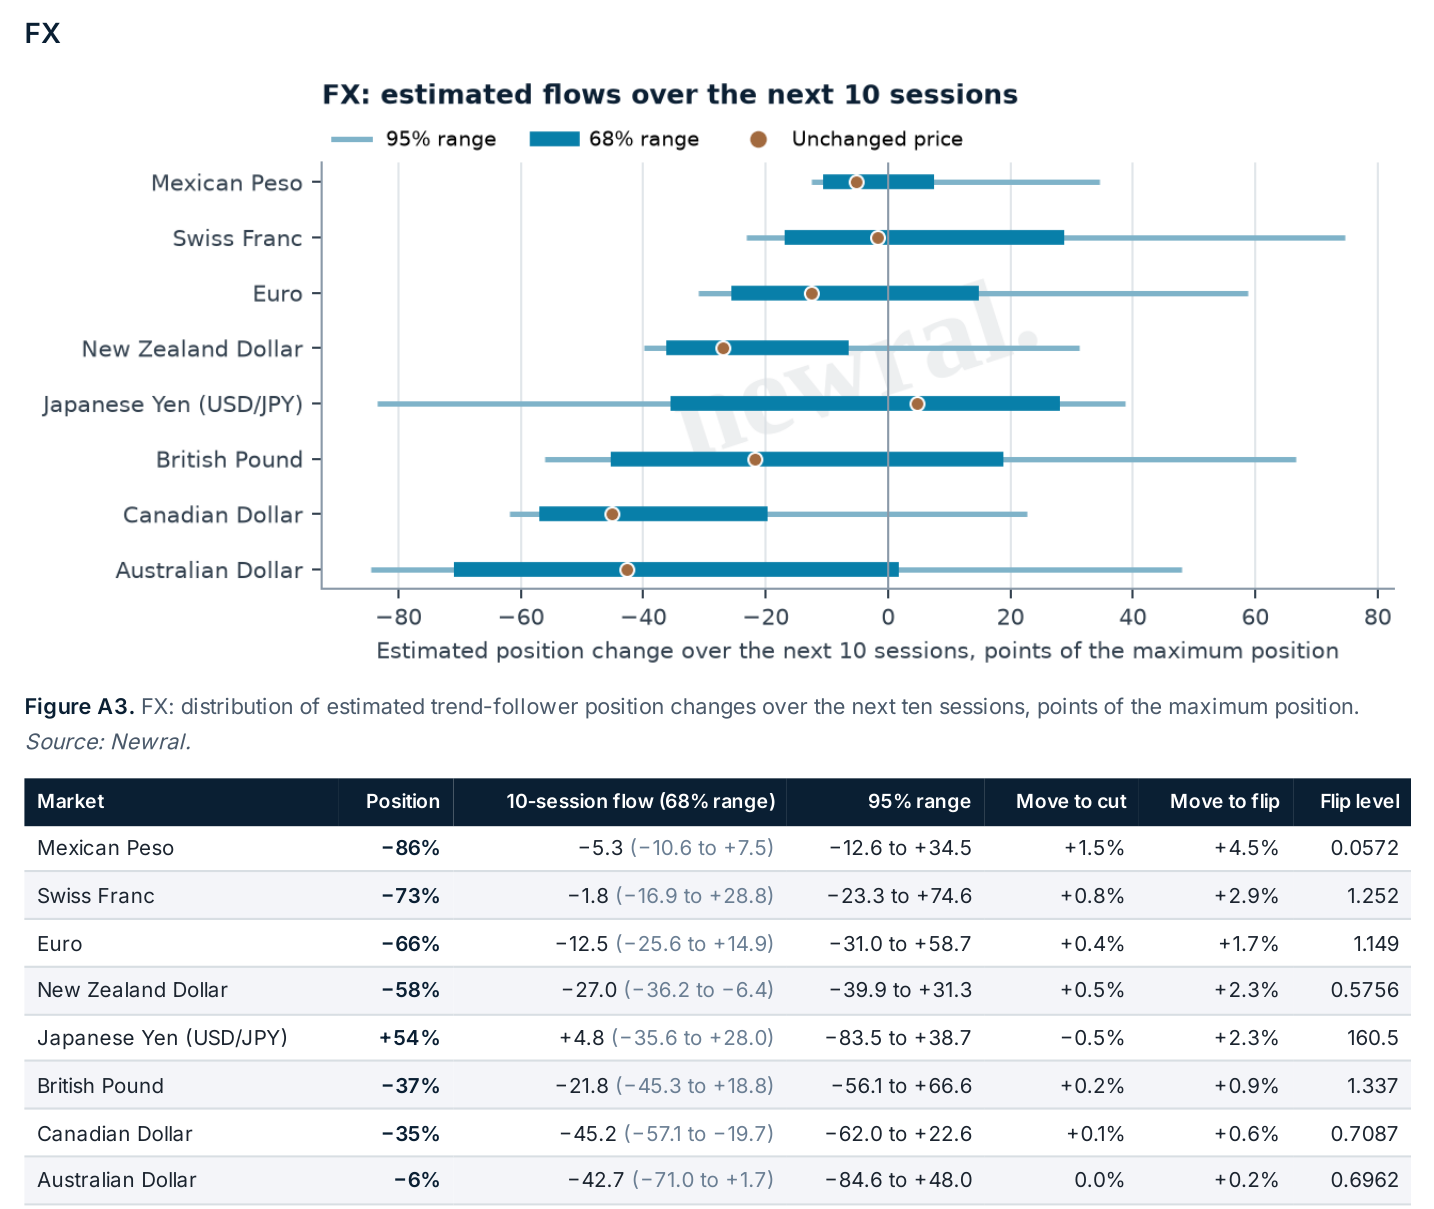
- FX: the book leans long the dollar, and selling of the Australian dollar has further to run.
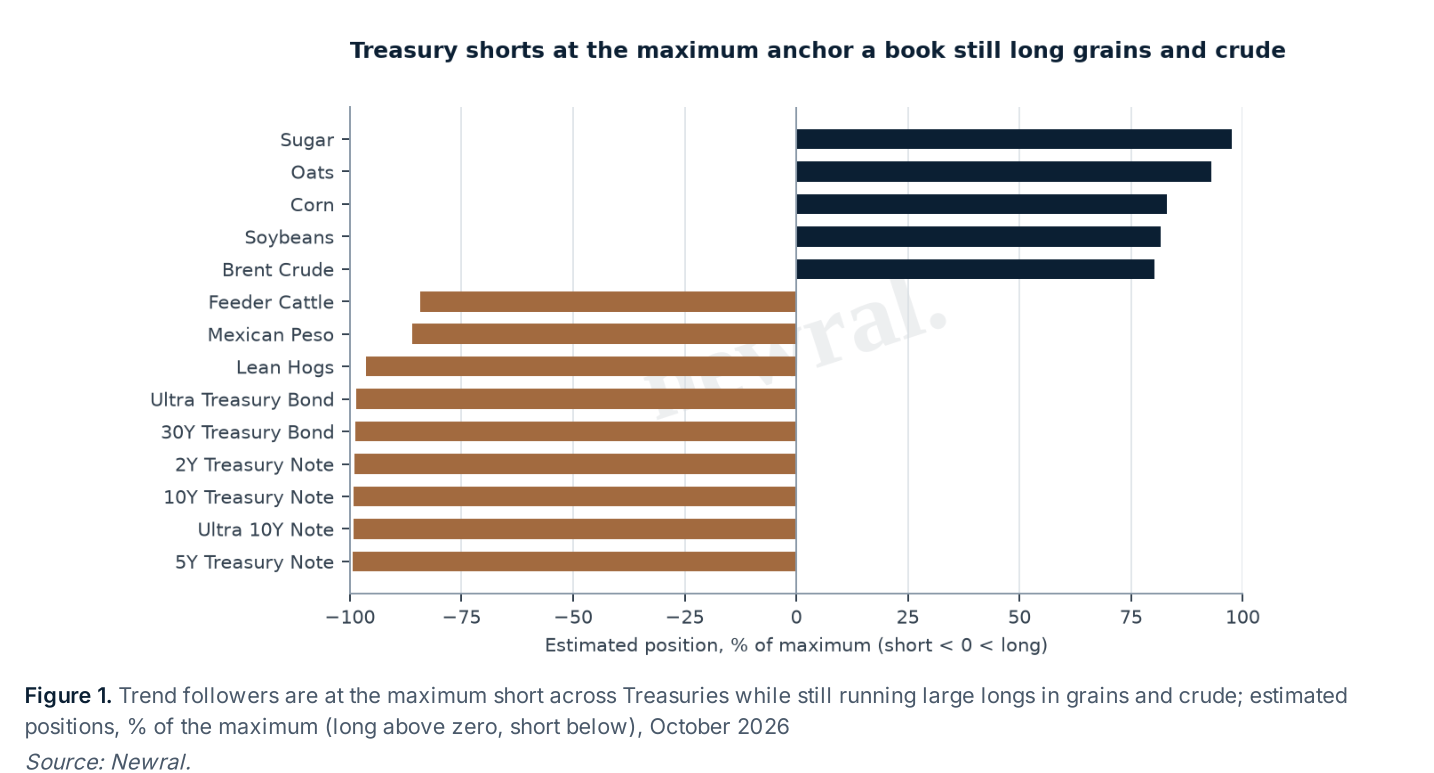
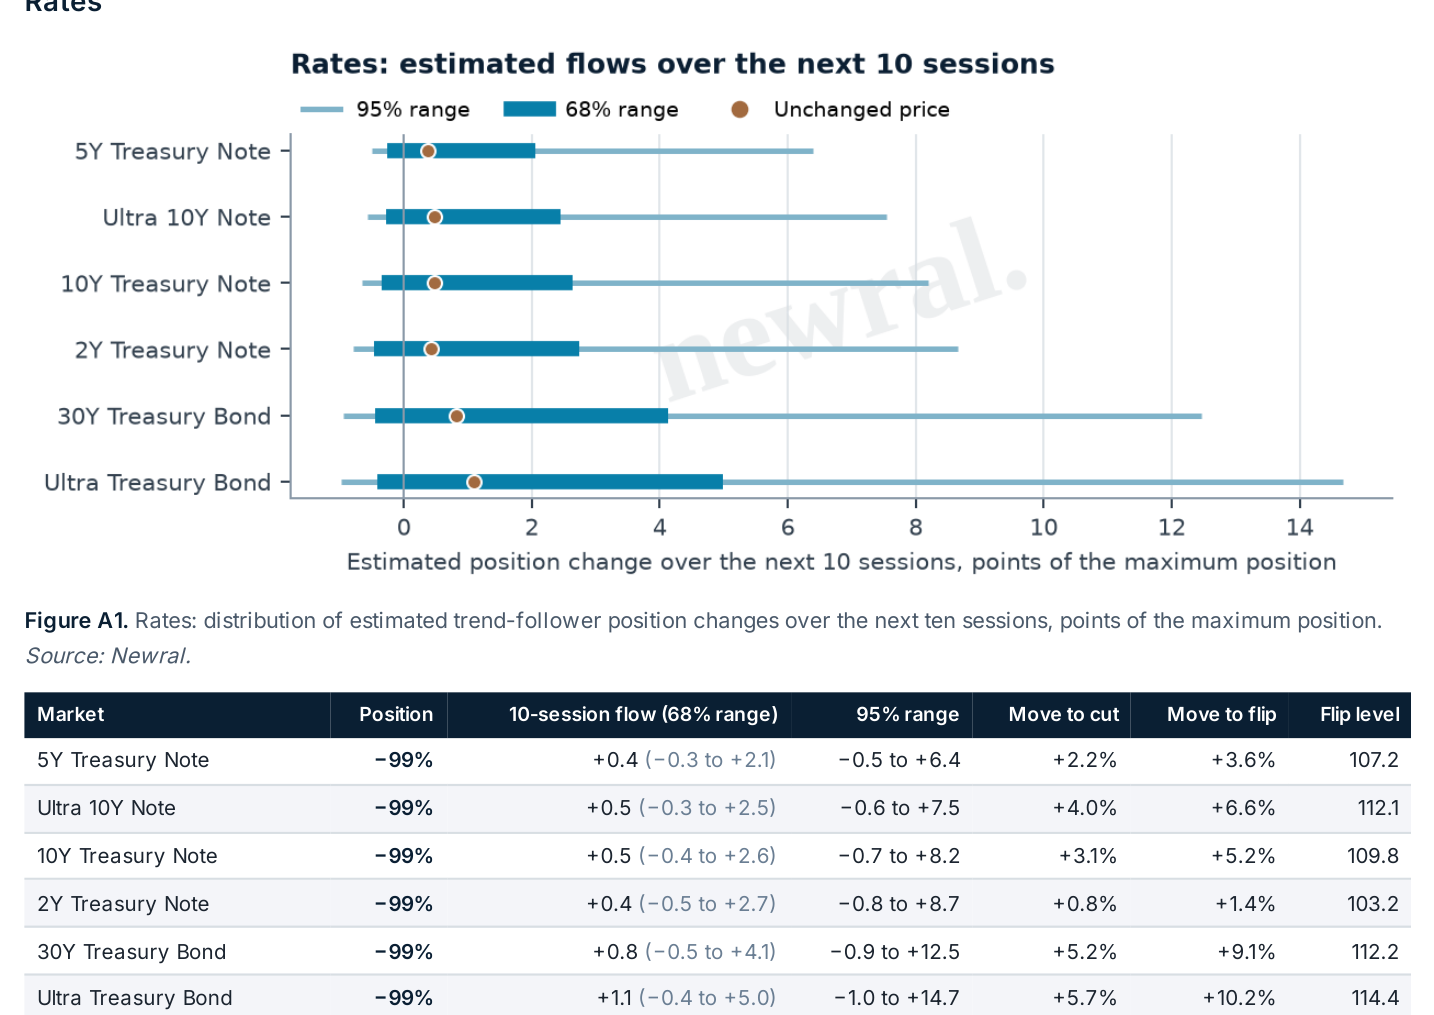
- Rates: every Treasury contract sits at the maximum short, so the remaining flow risk is short-covering, not more selling.
From the model overview
Every market in the book, with its estimated position, expected flow over the next ten sessions and the price moves that would force trend followers to cut or flip.
Sample note
Request a sample note
The full report, including every market, is in the sample.