Business cycle map: where the US and the Euro Area sit in the cycle
The business cycle map shows where the US and the Euro Area sit in their growth cycle. Newral reads a broad set of activity, labour, financial, sentiment, credit, housing and external indicators against their recent norms, then places each economy in one of four phases: firm and improving, firm and cooling, soft and improving, or soft and cooling.
The question it answers
Is activity in the US and the Euro Area running above or below its recent norm, and is it improving or cooling?
How it works
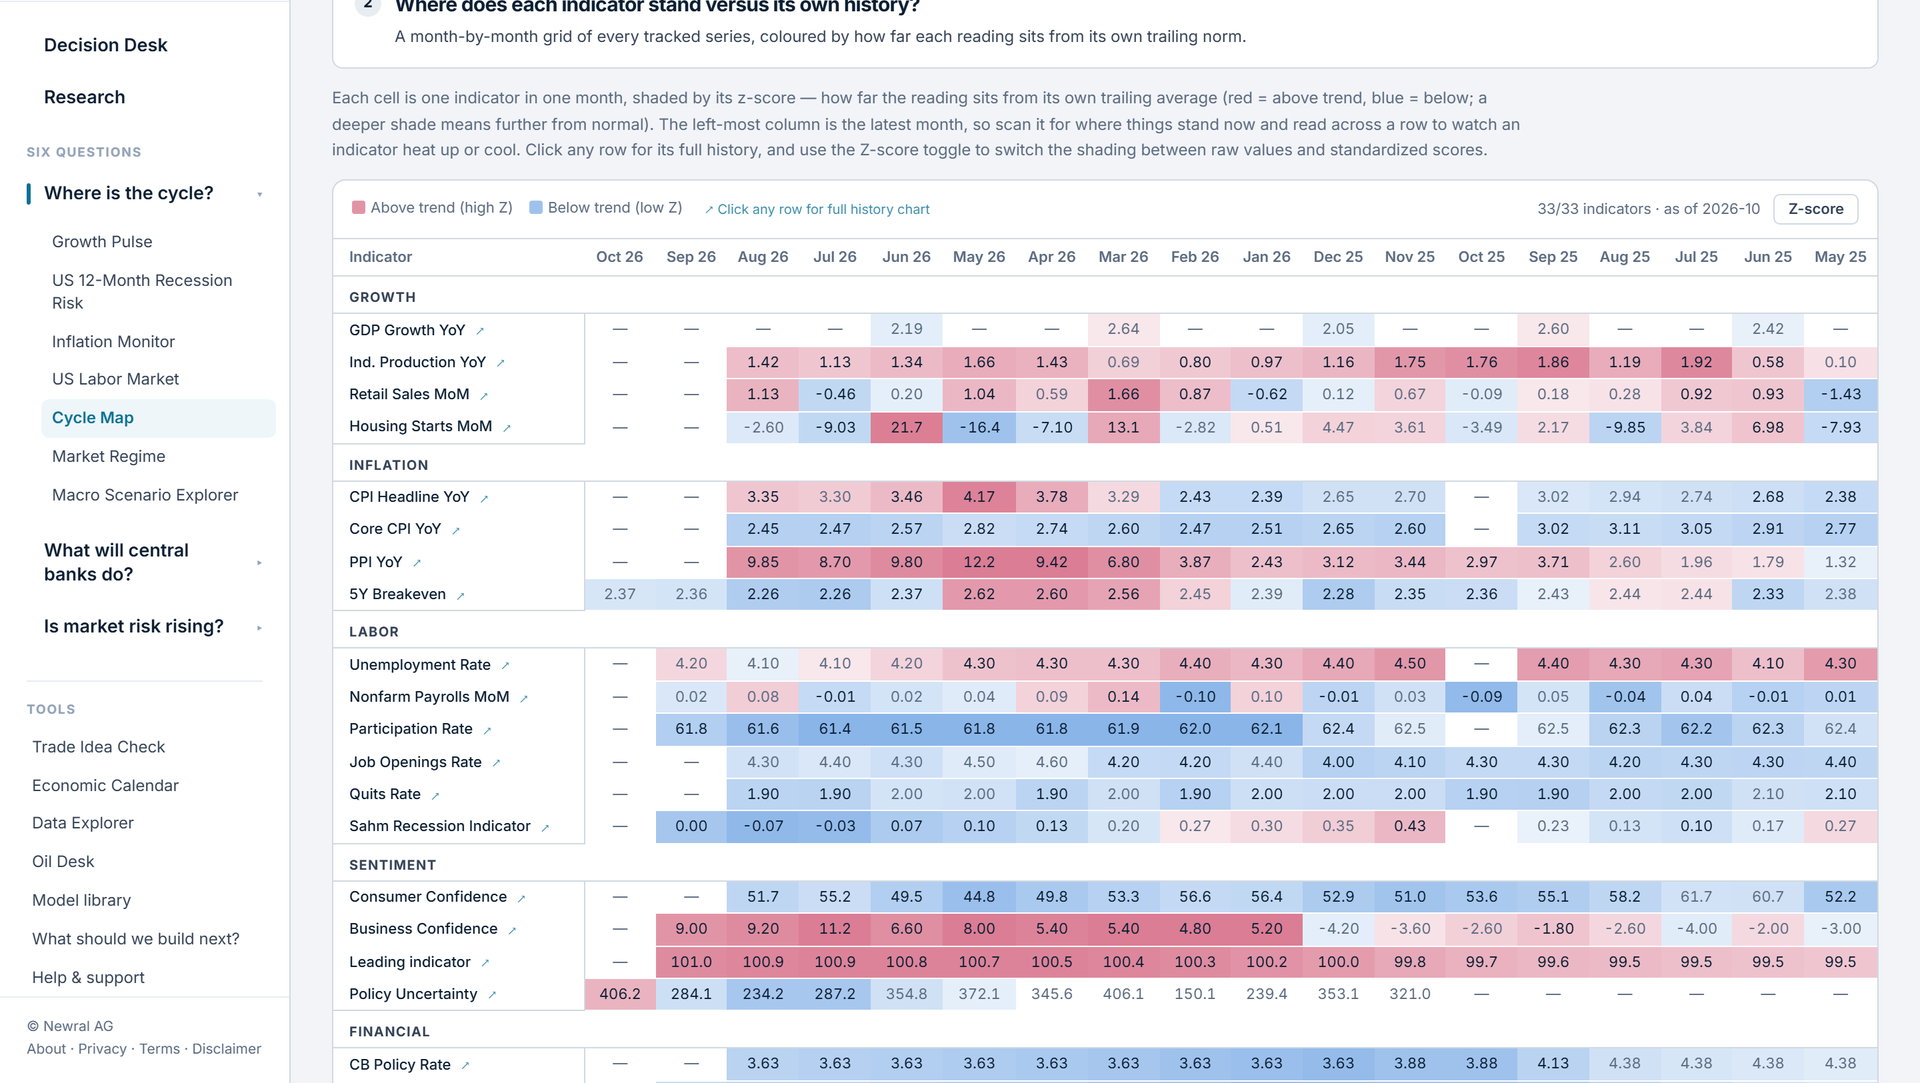
The map draws on official statistics, business and consumer surveys and financial indicators, grouped into growth, labour, financial conditions, sentiment, credit, housing and external trade. Each indicator is read against its own recent norm, so the map shows how unusual a reading is rather than its absolute level. Newral combines the indicators into a view of two things: whether activity is running above or below normal, and whether it is improving or cooling. Together these place each economy in one of four phases, which keeps the strength of activity separate from its direction of travel. The heatmap beneath shows every indicator month by month, so you can see whether a reading is broad-based or driven by a few series, and which areas are turning first.
What you see in the portal
- The cycle phase for the US and the Euro Area: firm or soft, improving or cooling
- A one-line verdict on what the phase means for the backdrop
- A month-by-month heatmap of every tracked indicator against its own history
- An indicator count showing how much of the evidence is available
- Indicator drill-downs with history and cross-country comparison
How clients use it
- Frame medium-term allocation around where each economy sits in the cycle.
- Spot which areas of the economy are turning first, before the headline phase changes.
- Compare the US and Euro Area cycles when weighing relative growth exposure.
Frequently asked questions
- What is a business cycle map?
- A business cycle map places an economy in its growth cycle by combining many indicators into a view of level and direction. Newral's map shows whether activity in the US and the Euro Area is above or below its recent norm and whether it is improving or cooling, with a heatmap of the indicators behind that read.
- What are the four phases of the business cycle?
- Newral uses four phases defined by level and direction: firm and improving, firm and cooling, soft and improving, and soft and cooling. They correspond to the familiar expansion, slowdown, recovery and contraction stages. Keeping level and direction separate shows, for example, when an economy is still strong but losing momentum.
- Is a soft, cooling cycle reading a recession call?
- No. The cycle map measures activity against its recent norm, so a soft and cooling reading means activity is below that norm and still softening. It is a growth-cycle reading, not a recession call. It moves slowly and is best used for medium-term framing rather than market timing.
- Which indicators feed the business cycle map?
- The map combines official statistics, surveys and financial indicators across growth, labour, financial conditions, sentiment, credit, housing and external trade. Typical inputs include industrial production, retail sales, unemployment, business and consumer confidence, credit spreads and housing activity. Each series is read against its own history, so the map shows how unusual a reading is rather than its absolute level.