Research
Systematic fair value report
Prices can drift far from what fundamentals support. This report highlights the largest rich and cheap readings across markets against their fundamental anchors, how far each has stretched, and what could bring it back.
The models behind this research: Systematic fair value.
Structure
What's inside
- Key messages: the most stretched markets, rich and cheap, stated up front.
- Evidence: each market against its fundamental anchors, and how the gap has developed.
- Context: why a gap has opened and whether it is widening or narrowing.
- Implications: what the readings mean for positioning and risk.
- What would change our view: the developments that would close or widen a gap.
Edition of 5 October 2026
Philippine peso: fair value has risen and spot has not followed
Key messages
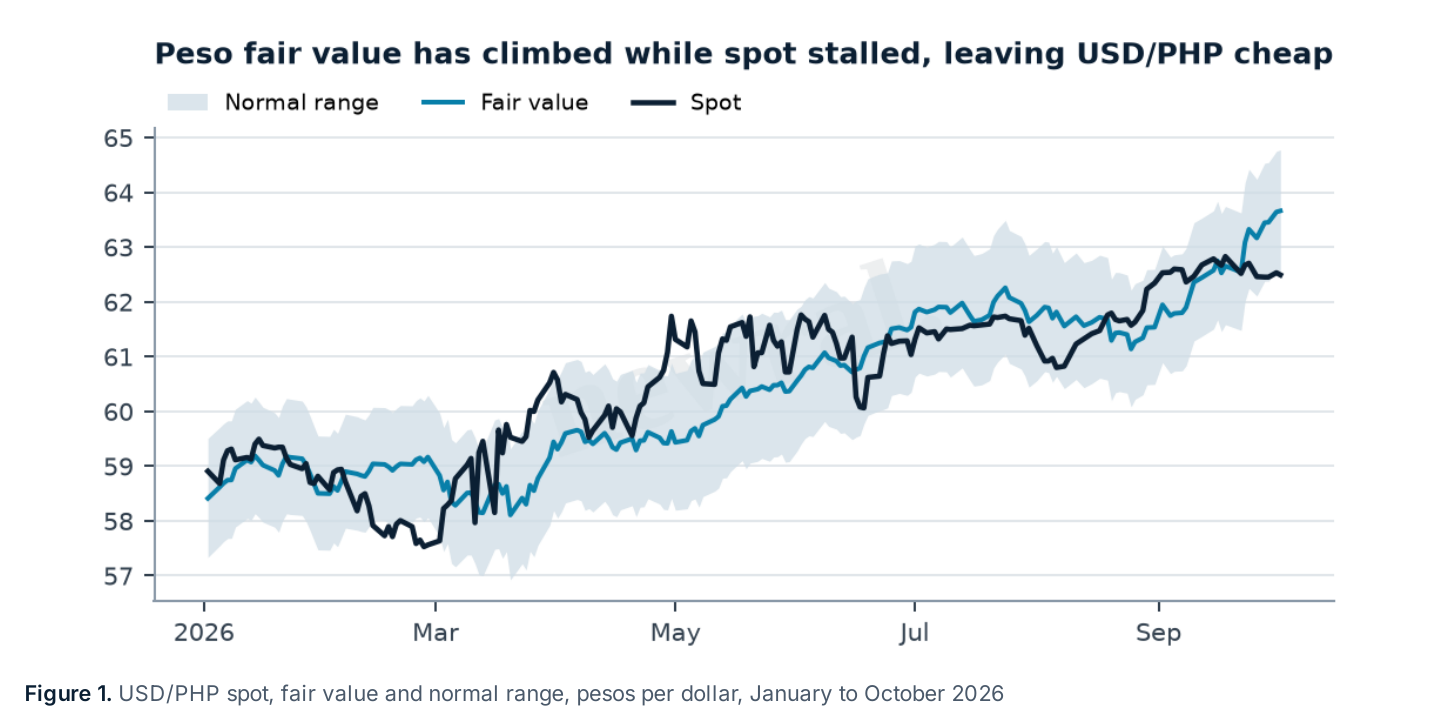
- USD/PHP trades about 1.8% below our fair-value estimate, more than twice the usual size of its gap.
- Fair value has risen about 3.5% since late August while spot barely moved; US real yields and credit conditions account for almost all of the shift.
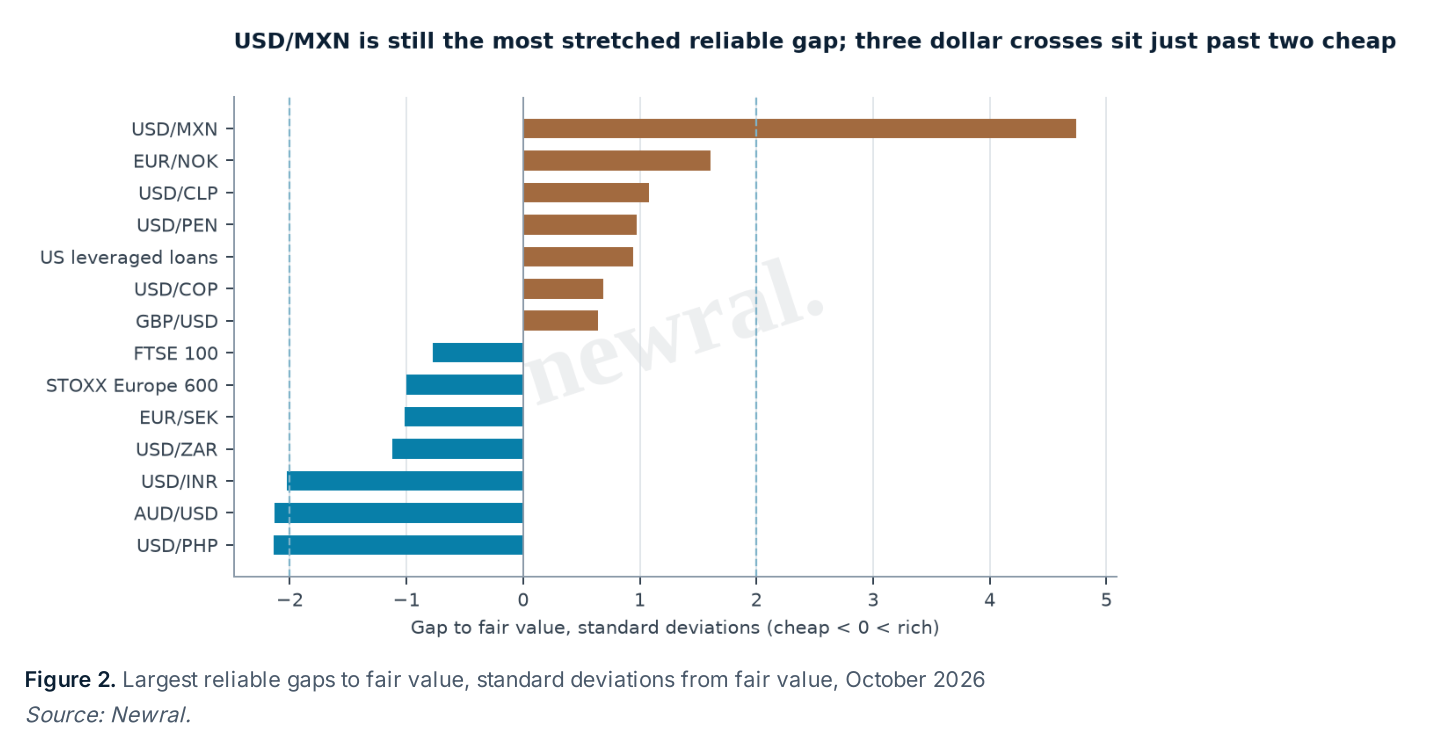
- USD/MXN remains the most stretched reliable reading on our screen, while three dollar crosses sit just past two standard deviations cheap.
- Gaps are only read where the model's fit is statistically reliable; everything else is marked as model off.
From the model overview
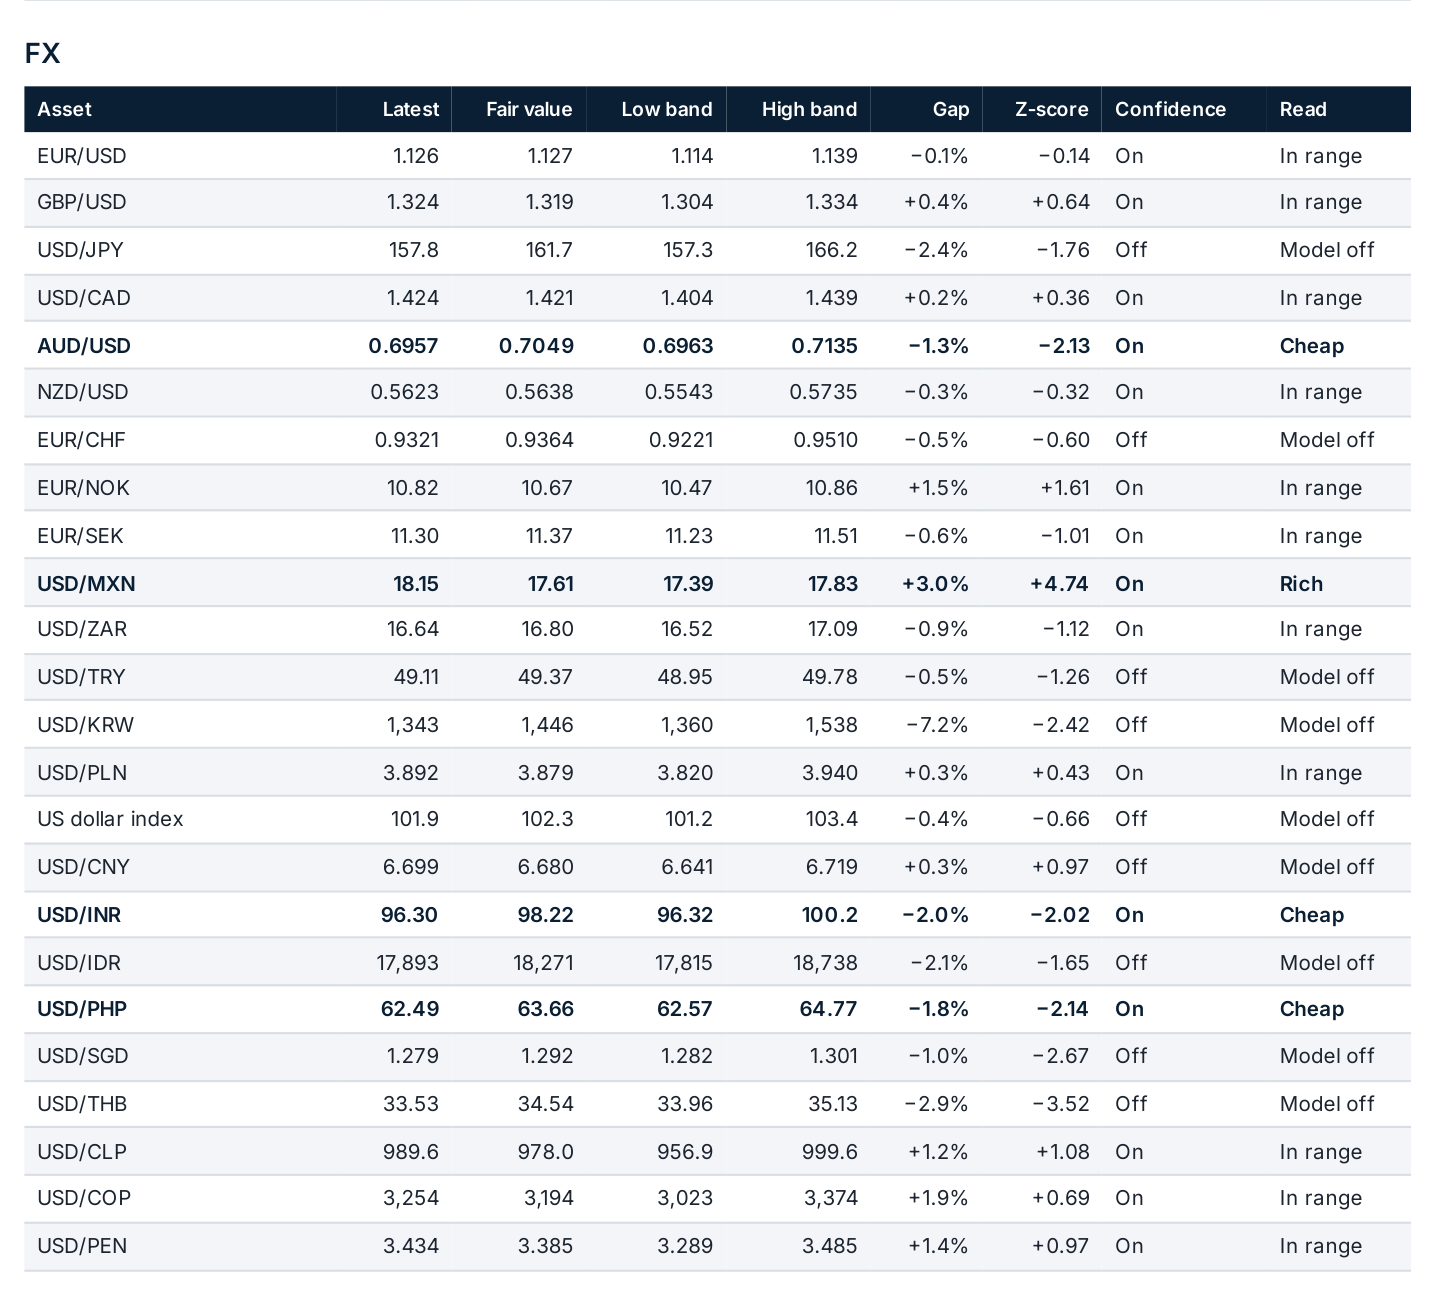
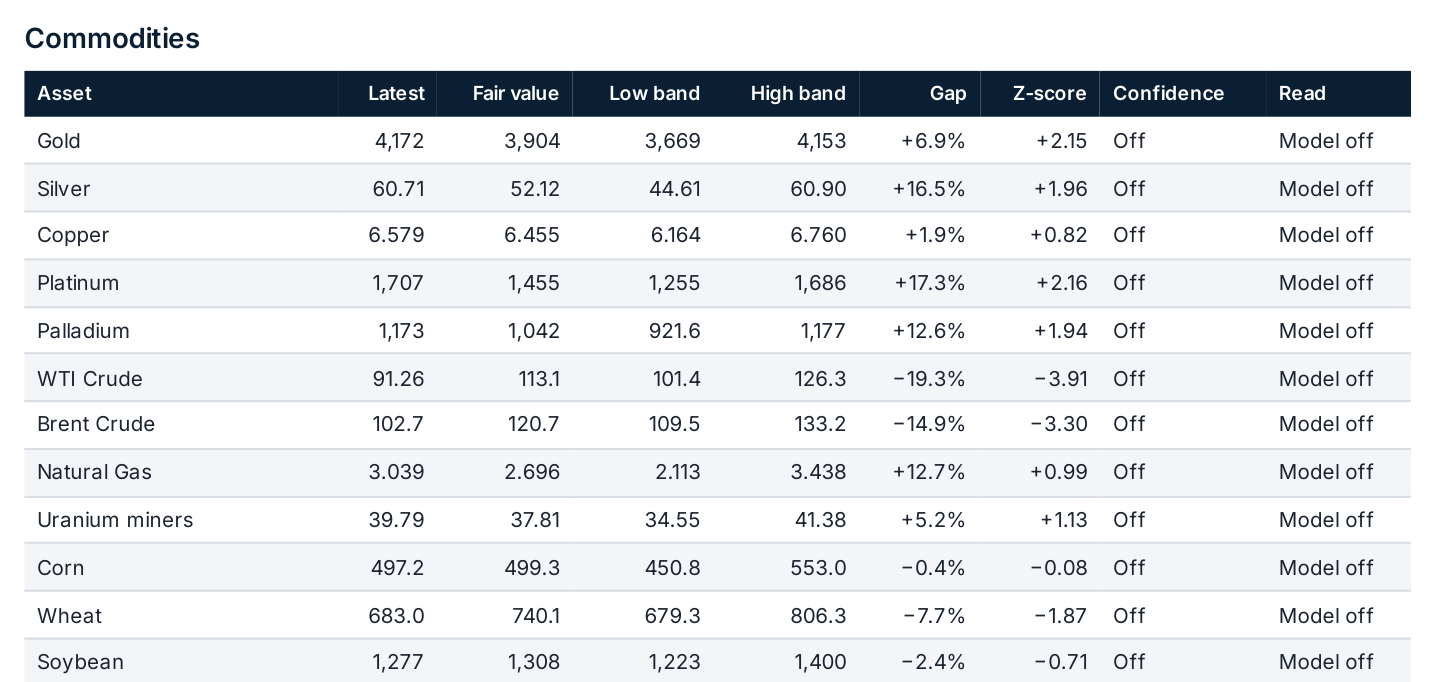
The complete valuation map: every tracked market against its fair value, normal range, gap, z-score and whether the model's read is reliable.
Sample note
Request a sample note
The full report, including every market, is in the sample.