Research
Cross-asset report
Markets rarely move in isolation. This report brings together what changed across rates, FX, equities, credit and commodities, connects it to the economy and policy, and sets out what it means for the decisions in front of you.
The models behind this research: Business cycle map and Central bank assessment.
Structure
What's inside
- Key messages: the conclusions first, across asset classes.
- Evidence: the data, models and market signals behind each view, including those that cut against it.
- Connections: how moves in one market feed into others.
- Implications: what it means for markets and portfolios.
- What would change our view: the developments that would make us think again.
Edition of 5 October 2026
The labour market has cracked and the forced bond sellers are spent
Key messages
- The economy is turning before inflation does: payrolls collapsed, an October hike is priced out, and our cycle map now reads contraction.
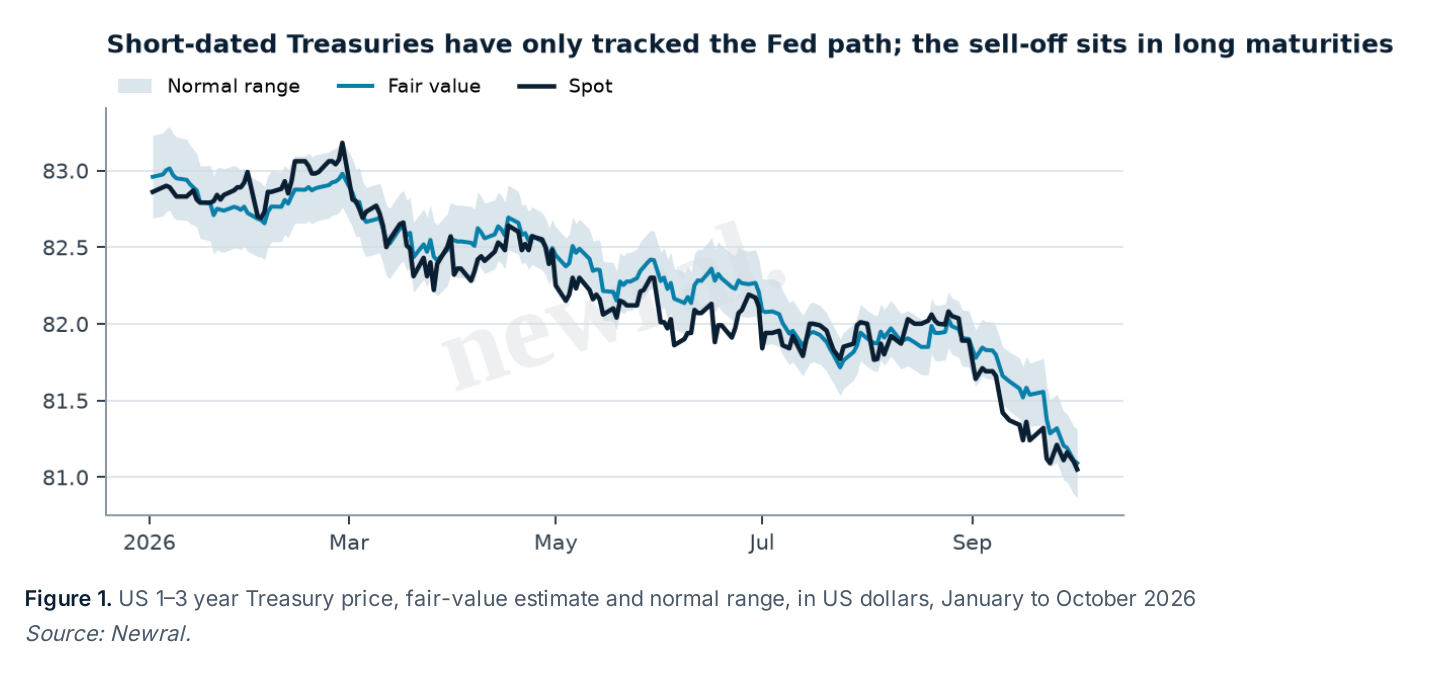
- Bonds have not believed it yet: short-dated Treasuries track the policy path, while oil and supply drive the long end.
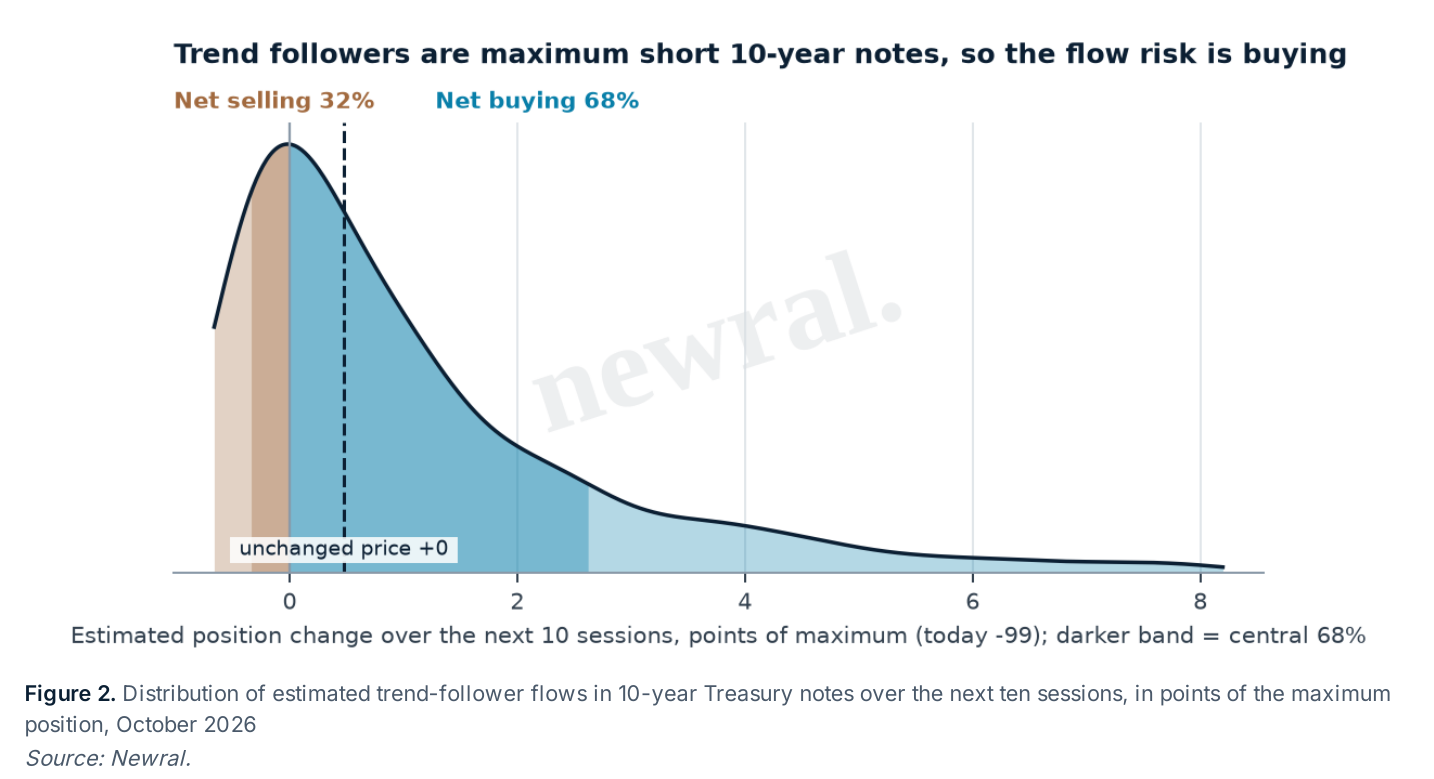
- Trend followers are at the maximum short in 10-year notes, so the remaining flow risk is buying, not selling.
- Oil is the main risk to the view: its fair value has climbed much faster than its price.
Sample note
Request a sample note
The full report, including every market, is in the sample.